On this page
AI tech stack statistics are data points measuring how startups and enterprises adopt, invest in, and build with AI infrastructure — covering tools, frameworks, cloud spend, ROI, and failure rates across the full lifecycle of AI development. In 2026, 78% of organizations use AI in at least one business function, yet more than 80% of AI projects fail to deliver measurable business value.
Here are 50+ AI tech stack statistics for 2026, sourced from McKinsey, Gartner, MIT, Stack Overflow, and more — covering adoption rates, infrastructure costs, tool market share, ROI benchmarks, and failure patterns.
Key AI Tech Stack Statistics at a Glance
- 80% of early-stage SaaS startups now use AI tools in their tech stacks (HubSpot, 2025)
- 95% of AI pilots fail to reach production deployment — infrastructure gaps cause 64% of failures (MIT NANDA, 2025)
- 78% of organizations use AI in at least one business function, yet 62% remain in experimentation (McKinsey, 2025)
- AI-native startups generate $3.48M revenue per employee — 6x the SaaS industry average (Thunderbit, 2026)
- Anthropic holds 40% of enterprise LLM spend, surpassing OpenAI (27%) for the first time (Menlo Ventures, 2025)
- The average enterprise runs 4.2 AI models in production, vs. 1-2 for early-stage startups (Gartner, 2026)
- $202.3 billion in total AI sector VC investment in 2025 — a 75%+ year-over-year increase (Crunchbase / Ropes & Gray, 2025)
- 98% of organizations are now actively managing AI costs — up from 31% two years ago (FinOps Foundation, 2026)
- Ollama (51%) and LangChain (33%) are the leading AI agent orchestration frameworks among active agent builders (Stack Overflow Developer Survey 2025)
Table of Contents
- What Is an AI Tech Stack?
- AI Adoption Statistics: How Many Startups Use AI in 2026?
- AI Tech Stack Investment and Funding Statistics
- Most Popular AI Tools and Frameworks Startups Use
- AI Infrastructure Cost Statistics for Startups
- AI Tech Stack Performance and ROI Statistics
- AI Project Failure Rate Statistics
- Agentic AI and the Next-Generation Tech Stack
- Enterprise vs. Startup AI Stack: Key Differences
- What These AI Tech Stack Statistics Mean for Your Startup
- Frequently Asked Questions
What Is an AI Tech Stack?
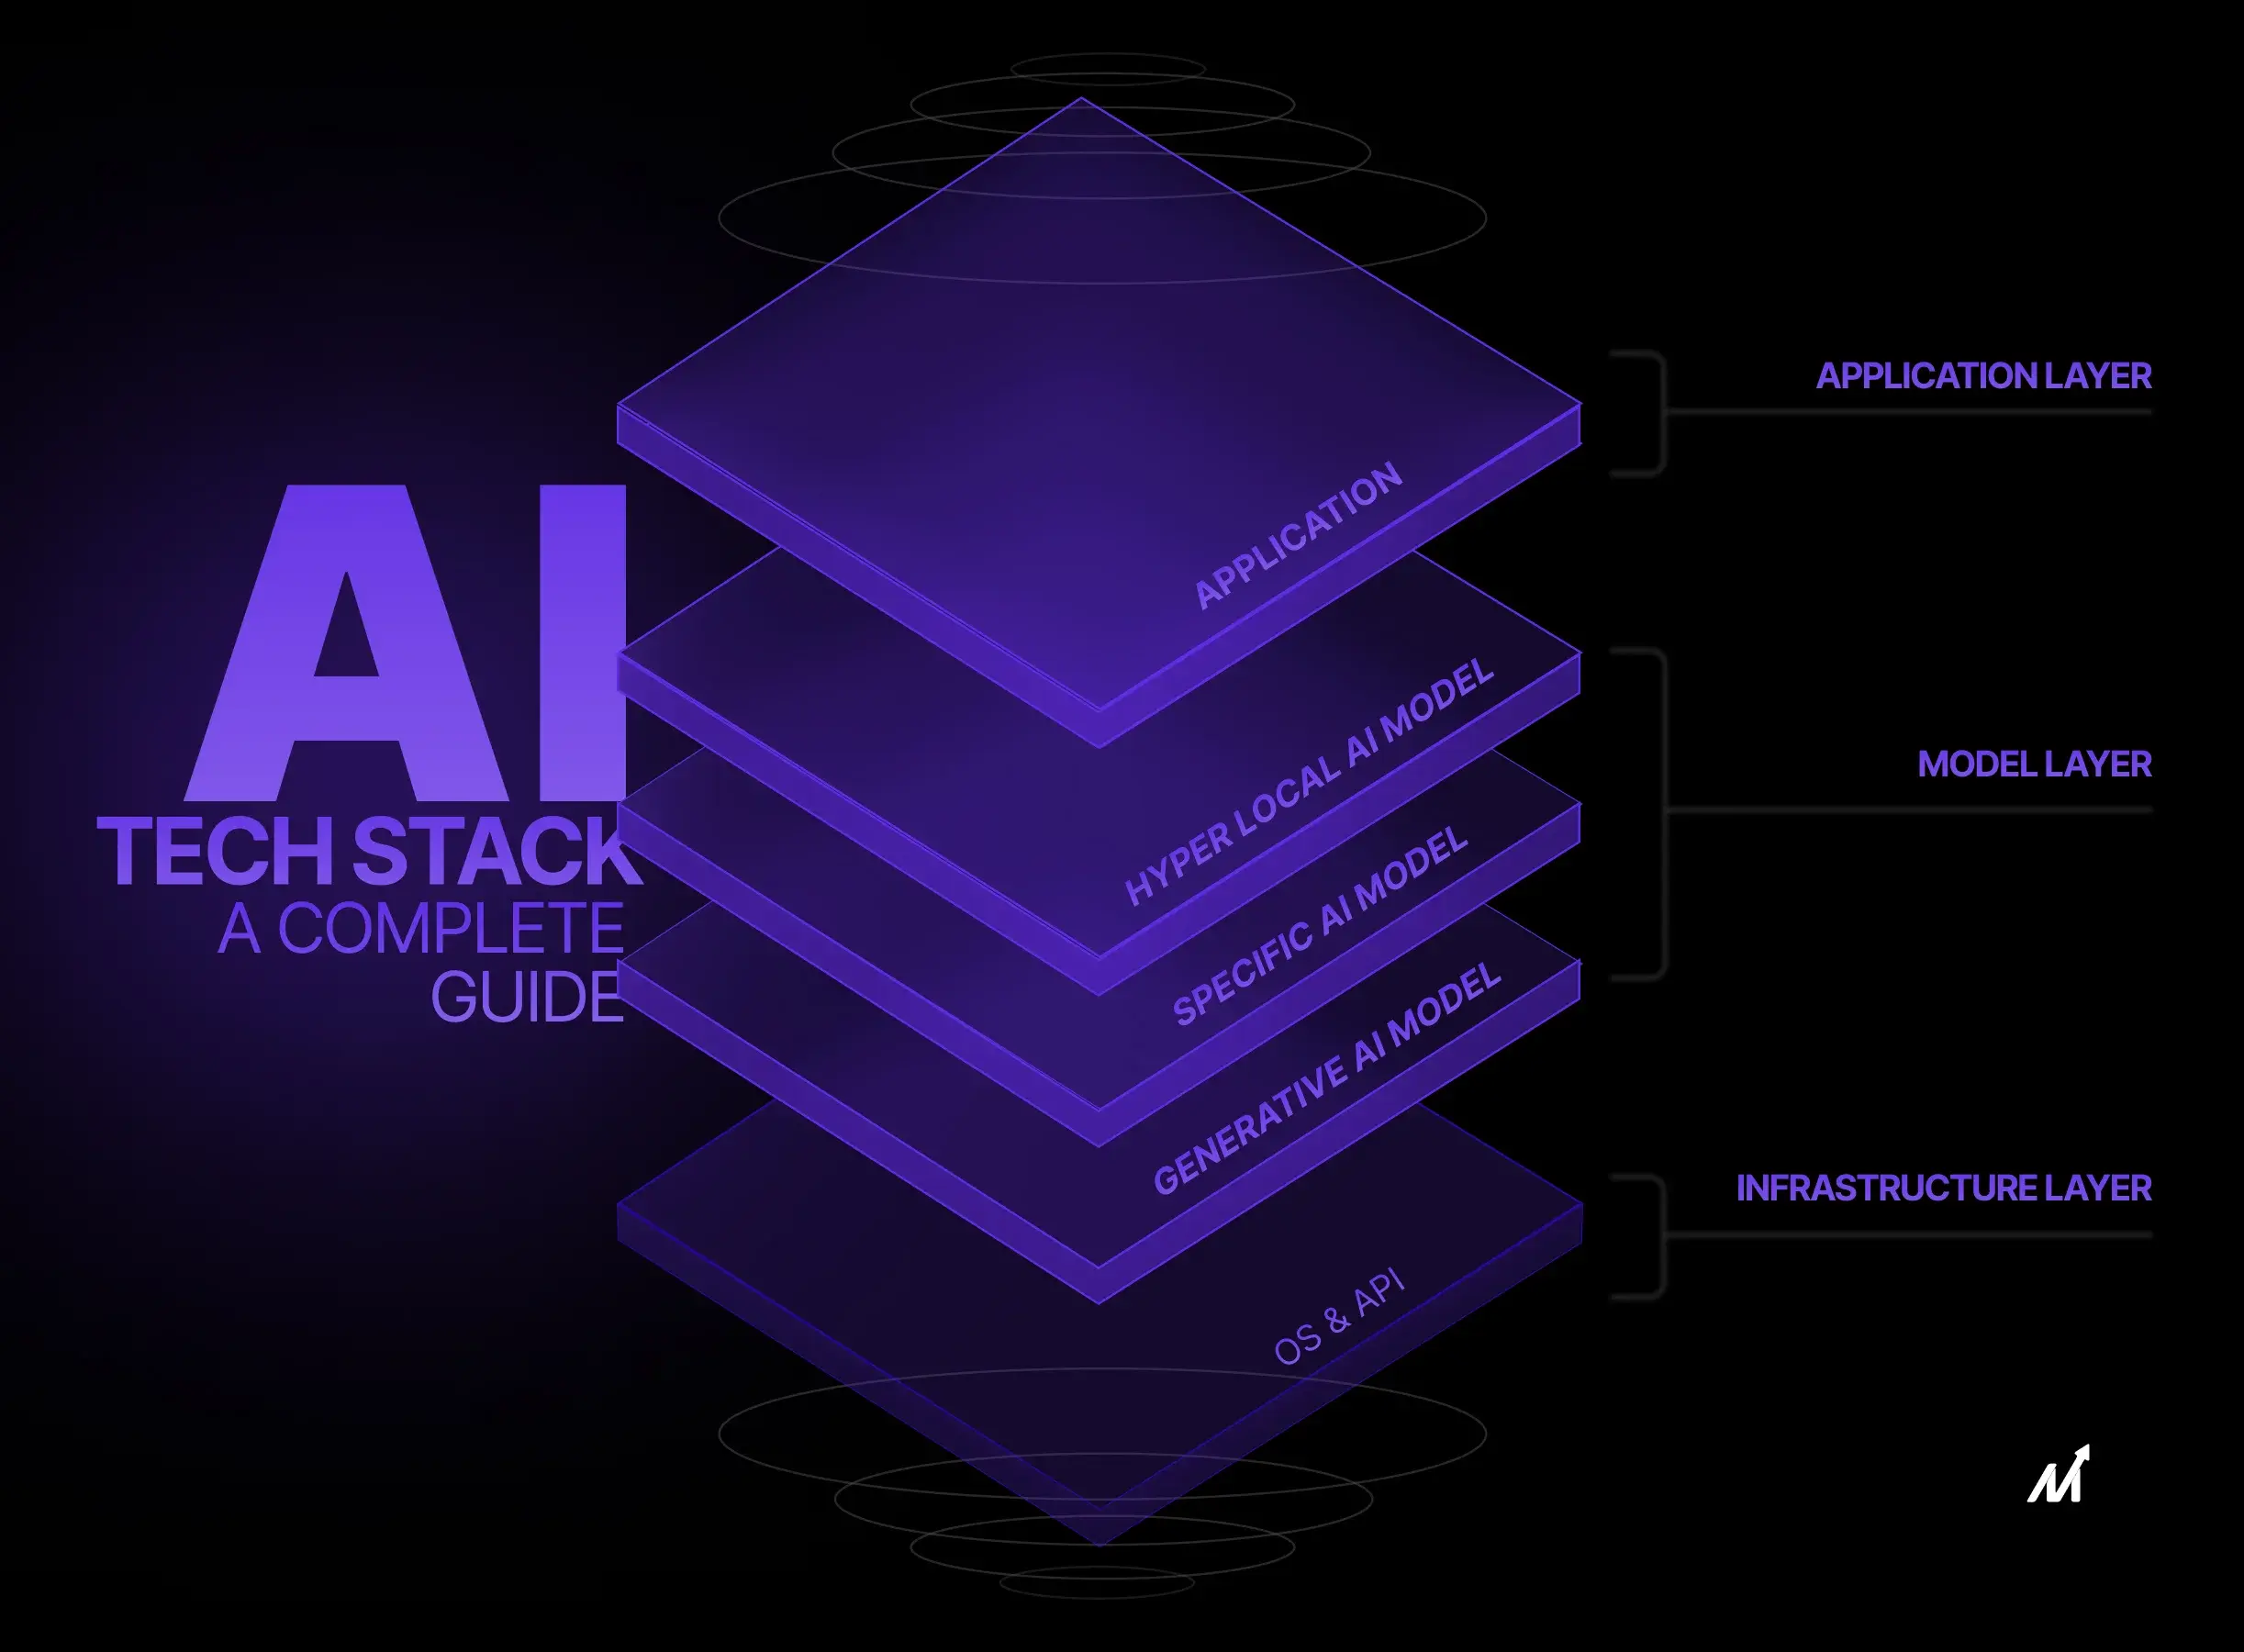
An AI tech stack is the combination of tools, frameworks, cloud infrastructure, and data pipelines an organization uses to build, deploy, monitor, and scale AI-powered applications and workflows. Unlike a traditional software stack focused on web servers, databases, and application frameworks, an AI tech stack adds distinct layers: large language models (LLMs) or foundation models, vector databases for semantic search, orchestration frameworks for multi-step AI agents, MLOps platforms for model versioning and monitoring, and GPU compute infrastructure for training and inference — each adding cost and complexity as a startup scales from prototype to production.
The core layers of a modern AI tech stack include:
- Foundation models / LLMs — OpenAI GPT-4o, Anthropic Claude, Google Gemini
- Orchestration / agent frameworks — LangChain, Ollama, AutoGPT
- Vector databases — ChromaDB, pgvector, Redis
- ML training frameworks — PyTorch, TensorFlow
- MLOps and observability — MLflow, Weights & Biases, LangSmith
- Cloud compute — AWS, GCP, Azure, and alternative GPU providers
- Data pipelines — for ingestion, transformation, and quality management
- Application layer — APIs, UIs, and business logic connecting AI to end users
The distinction that matters for startups: most early-stage teams start with just layers 1 and 7, relying entirely on hosted LLM APIs. As they scale, they add orchestration, observability, and eventually custom fine-tuning — a progression that dramatically changes cost and complexity.
AI Adoption Statistics: How Many Startups Use AI in 2026?
AI adoption among startups has crossed the majority threshold in 2026, but the gap between "using AI" and "scaling AI" remains wide. These AI tech stack statistics reveal where most organizations actually stand.
General adoption rates:
- 78% of organizations now use AI in at least one business function (McKinsey State of AI 2025)
- 71% of organizations regularly use generative AI in at least one business function, up from 33% the prior year (McKinsey State of AI 2025)
- 65% of organizations use generative AI in at least one business function — double the rate from 10 months earlier (McKinsey Q1 2026, via Medha Cloud)
- AI use has grown from 55% to 78% of organizations in one year, yet 62% remain in experimentation without fully scaled deployments (Netguru 2026)
Startup-specific adoption:
- 80% of early-stage SaaS startups utilize AI tools (HubSpot Startups AI Report 2025)
- 61% of AI-using startups report profitability vs. 54% of non-AI-using startups — a 7-point gap that widens at scale (HubSpot Startups AI Report 2025)
- 47% of Y Combinator's Spring 2025 cohort is building AI agents — a shift from AI assistance to autonomous task completion (Thunderbit, 2026)
- AI-using startups secure funding 2.5x faster than those without AI integration (startup funding analysis via Cubeo AI)
- AI-native startups reach $30M ARR in 20 months vs. 60+ months for traditional SaaS companies (Cubeo AI / BVP Atlas, 2025)
Size and scale disparities:
- 83% of companies with 5,000+ employees have deployed AI vs. only 42% of firms with 50-499 employees (enterprise AI adoption analysis 2026)
- The average enterprise runs 4.2 AI models in production, up from 1.9 in 2023 — while most early-stage startups run 1-2 (Gartner, via Medha Cloud)
- Generative AI adoption reached 54.6% in three years — faster than personal computers or the internet at the same point in their timelines (AmplifAI, 2026)
AI Tech Stack Investment and Funding Statistics
Capital flowing into AI infrastructure is reshaping what's possible — and what's expected — for startups entering the market in 2026. These AI investment statistics reflect a market where AI is no longer optional.
- $202.3 billion in total AI sector investment in 2025 — a 75%+ year-over-year increase from $114 billion in 2024 (Crunchbase / Ropes & Gray AI Report H1 2025)
- AI startups attracted $89.4 billion in global venture capital in 2025 — 34% of all VC investment despite comprising only 18% of funded companies (Crunchbase, 2025)
- Generative AI VC funding reached $49.2 billion in H1 2025 alone — surpassing the entire 2024 total (Equisy.io / Cubeo AI)
- 58% of AI startup funding flows into mega-rounds ($500M+) — capital is concentrated in foundation model companies (Thunderbit, 2026)
- Foundation model companies raised $80 billion in 2025 — 40% of global AI funding, more than doubling from $31 billion in 2024 (Crunchbase, 2025)
- Seed-stage AI startups receive valuations approximately 42% higher than non-AI peers (VC market data 2025)
- Private AI investment in the US reached $109.1 billion — nearly 12x China ($9.3B) and 24x the UK ($4.5B) (Stanford AI Index 2025)
- Hyperscaler capex projected to reach $660-690 billion in 2026 — ~75% tied directly to AI infrastructure (Futurum Group, 2026)
- Gartner forecasts worldwide AI spending at $2.52 trillion in 2026, up 44% YoY — AI infrastructure accounts for $1.37T, services $588B, software $452B (Gartner, January 2026)
- AI-native startups achieve $3.48M revenue per employee — approximately 6x higher than other SaaS companies (Thunderbit, 2026)
- At least 60 AI-native businesses have already crossed $100M ARR; at least 50 are projected to reach $250M ARR by end of 2026 (Sapphire Ventures 2026 Outlook)
Most Popular AI Tools and Frameworks Startups Use
The AI tech stack statistics from Stack Overflow's 2025 developer survey (49,000+ respondents) give the clearest picture of what's actually running in production — not just what teams have experimented with.
Top AI tools and frameworks by adoption:
- OpenAI GPT-4o — still the most widely accessed LLM API for production applications
- Anthropic Claude — fastest-growing enterprise LLM (40% enterprise spend share in 2025)
- Ollama — 51% of developers use Ollama for AI agent orchestration (Stack Overflow Developer Survey 2025)
- LangChain — 33% of developers use LangChain for agent orchestration (Stack Overflow Developer Survey 2025)
- PyTorch — claims over 55% of production ML framework share in Q3 2025 (Kellton, 2026)
- Redis — used by 43% of teams for AI agent data storage (Stack Overflow Developer Survey 2025)
- MLflow — the most widely adopted open-source MLOps platform for experiment tracking (Kellton, 2026)
Which AI tools do startups use most?
The most widely used AI tools among startups are OpenAI's GPT-4o and Anthropic's Claude for LLM APIs, Ollama (51%) and LangChain (33%) for agent orchestration, Redis (43%) for agent data storage, and PyTorch for ML model training. At the developer productivity layer, GitHub Copilot and Cursor are used by the majority of engineering teams — with 84% of developers now using or planning to use AI tools in development, and 51% using them daily.
Developer AI tool usage:
- 84% of developers use or plan to use AI tools in development (up from 76%); 51% use AI tools daily (Stack Overflow Developer Survey 2025)
- 82% of developers used AI tools weekly in Q1 2025; 59% ran three or more AI tools in parallel — confirming multi-model strategies are now standard (Stack Overflow Developer Survey 2025)
- 57% of LangChain survey respondents have AI agents in production; quality is the top production barrier (cited by 32%) (LangChain State of AI Agents Report, 1,300+ respondents)
- 89% of respondents have implemented observability for their AI agents; only 52% use evaluations — a critical gap (LangChain State of AI Agents Report)
Enterprise LLM provider market share shift is one of the most significant AI tech stack statistics of 2026:
| Provider | Enterprise Spend Share (2025) | Enterprise Spend Share (2023) | Direction |
|---|---|---|---|
| Anthropic (Claude) | 40% | 12% | ↑ 3.3x growth |
| OpenAI (GPT models) | 27% | 50% | ↓ Lost nearly half |
| Google (Gemini) | 21% | 7% | ↑ 3x growth |
| Others (Llama, Mistral, Cohere) | 12% | 31% | ↓ Fragmented |
| Top 3 combined | 88% | 69% | More concentrated |
Source: Menlo Ventures State of Generative AI in the Enterprise 2025
Additional breakdown: Anthropic commands approximately 54% of the coding AI market vs. 21% for OpenAI (Menlo Ventures, 2025). Meta's Llama remains the most widely adopted open-weight model in the enterprise for teams building on-premises deployments.
AI Tech Stack Framework Comparison — Startup Quick Reference:
| Layer | Tool | Adoption Rate | Best For | Open Source? |
|---|---|---|---|---|
| LLM API | Anthropic Claude | 40% enterprise spend | Coding, reasoning, enterprise | No |
| LLM API | OpenAI GPT-4o | 27% enterprise spend | General-purpose, broad ecosystem | No |
| LLM API | Google Gemini | 21% enterprise spend | Multimodal, Google Cloud integrations | No |
| Agent Orchestration | Ollama | 51% of agent builders | Local model running, self-hosted LLMs | Yes |
| Agent Orchestration | LangChain | 33% of agent builders | Multi-step agent chains, RAG pipelines | Yes |
| Vector Database | Redis | 43% of agent builders | Real-time, familiar ops tooling | Yes |
| Vector Database | ChromaDB | 20% of agent builders | Fast local dev, embedding storage | Yes |
| ML Framework | PyTorch | 55%+ production share | Custom model training, research | Yes |
| MLOps | MLflow | Most-adopted open-source | Experiment tracking, model registry | Yes |
Sources: Stack Overflow Developer Survey 2025; Menlo Ventures 2025; Kellton, 2026
AI Infrastructure Cost Statistics for Startups
Startup AI infrastructure costs are one of the most under-discussed variables in AI planning — and one of the most consequential. These benchmarks exist to help you budget more accurately.
How much does an AI tech stack cost per month for a startup?
Monthly AI tech stack costs range from $100–$500 for MVP-stage startups (0–100 users) up to $15,000–$100,000+ for enterprise deployments (10,000+ users), with the primary cost driver shifting from LLM API tokens at early stages to inference infrastructure and compliance at scale. Most teams underestimate costs significantly, making a 30-50% budget buffer essential.
AI cost benchmarks by startup stage:
| Stage | Users | Monthly AI Spend | Primary Cost Drivers |
|---|---|---|---|
| MVP / Beta | 0–100 users | $100–$500/mo | LLM API calls, minimal compute |
| Early Growth | 100–1K users | $500–$2,000/mo | LLM APIs, vector DB |
| Scale | 1K–10K users | $2,000–$15,000/mo | LLM APIs, vector DB, monitoring |
| Enterprise | 10K+ users | $15,000–$100,000+/mo | Inference, fine-tuning, compliance |
Source: Finout — AI Cost Drivers 2026; LLM cost modeling guides
Key cost benchmarks:
- LLM API token pricing ranges from $0.25 to $75 per million tokens depending on model and direction (businesswaretech.com, 2026)
- GPU cloud costs range from $2–$15/hour for AI workloads; alternative GPU cloud providers can be up to 75% cheaper than hyperscalers (dev.to cloud cost guide, 2026)
- Spot/reserved instances can reduce cloud costs by 70-80% for AI/ML training workloads (cloud cost optimization guide, 2026)
- Deploying a 7B–13B parameter model on-premises can reduce token costs by up to 18x vs. public cloud APIs (Kyanon Digital, 2026)
- Build cost breakdown: prompt-engineered API solution $20,000–$80,000; RAG-based enterprise system $80,000–$200,000; fine-tuning adds another $50,000–$200,000+ (Kyanon Digital, 2026)
- Budget 30-50% above projected API costs to account for retries, failures, and edge cases (LLM cost modeling for startups)
The AI FinOps shift:
- 98% of organizations are now actively managing AI spend — up from just 31% two years ago (FinOps Foundation State of FinOps 2026, via Ternary)
- AI cost management has become the #1 FinOps skillset priority for 2026
- AI costs should stay at 10-30% of total infrastructure budget post-product-market-fit; optimize aggressively if above that range (LLM cost modeling best practices 2026)
AI Tech Stack Performance and ROI Statistics
When AI deployments succeed, the returns are substantial. These AI tech stack statistics from IDC, McKinsey, and Deloitte establish what strong execution actually delivers.
- Average ROI of $3.50–$3.70 for every $1 invested in AI; leading companies report up to 10x that figure (IDC / Microsoft joint research)
- Organizations with gen AI adoption report average cost savings of 15.7% and 24.69% productivity increase (enterprise AI impact analysis 2025)
- AI is boosting productivity by 14% in customer service and 26% in software development (AI productivity research 2025, via Digital Silk)
- 92% of daily gen AI users cite productivity gains vs. 58% of less frequent users — frequency of use drives the return (enterprise AI productivity survey, via Tenet)
- Workers using gen AI save an average of 5.4% of their work hours weekly (Microsoft AI Economy Institute, 2025)
- Companies integrating AI end-to-end report 60% higher revenue growth than competitors (BCG AI integration study, via tech-stack.com)
- Deloitte identifies top AI ROI areas: customer service and experience (74%), IT operations (69%), planning and decision-making (66%) (Deloitte AI ROI study, via tech-stack.com)
Startup-specific performance benchmarks:
- AI-native startups that reach $125M ARR by year two have feature development cycles reduced from 8 weeks to 3 weeks (ICONIQ Capital / BVP Atlas State of AI 2025, via Cubeo AI)
- AI-native startups reach $30M ARR in 20 months — vs. 60+ months for traditional SaaS (Cubeo AI / BVP Atlas, 2025)
- 61% of AI-using startups report profitability vs. 54% of non-AI-using startups (HubSpot Startups AI Report 2025)
AI Project Failure Rate Statistics
The most important AI tech stack statistics are often the uncomfortable ones. Understanding why AI projects fail is more operationally useful than benchmarking success rates alone.
- More than 80% of AI projects fail to deliver intended business value — fewer than 20% achieve or exceed their business objectives (Pertama Partners AI Project Failure Statistics 2026)
- 95% of GenAI pilots fail to scale to production deployment; infrastructure limitations account for 64% of scaling failures (MIT NANDA — GenAI Divide: State of AI in Business 2025)
- 42% of companies abandoned most of their AI initiatives in 2025 (up from 17% in 2024); the average company abandoned 46% of its AI proof-of-concepts (Pertama Partners AI Project Failure Statistics 2026)
- Average sunk cost per abandoned AI initiative: $7.2 million; large enterprises abandoned an average of 2.3 initiatives in 2025 (Pertama Partners AI Project Failure Statistics 2026)
Root cause breakdown — why AI projects fail:
According to the Informatica CDO Insights 2025 survey, the top three obstacles to AI success are: 1. Data quality and readiness — cited by 43% of organizations 2. Lack of technical maturity — cited by 43% of organizations 3. Shortage of AI skills — cited by 35% of organizations
AI failure rates by industry (Pertama Partners analysis of RAND and multi-source data, 2026): - Financial Services: 82.1% - Healthcare: 78.9% - Manufacturing: 76.4% - Retail: 73.8% - Professional Services: 68.7%
What the data suggests:
- AI startup failure rate reaches 92% — higher than the general tech startup failure rate (AI startup failure rate analysis, ai4sp.org 2024)
What causes most AI projects to fail?
Data quality is the single biggest cause of AI project failure, cited by 43% of organizations alongside lack of technical maturity (43%) and AI skills gaps (35%), according to Informatica's CDO Insights 2025 survey. Infrastructure limitations account for 64% of the reasons why 95% of GenAI pilots fail to reach production, according to MIT Sloan's 2025 NANDA report (The GenAI Divide: State of AI in Business 2025) — meaning most failures happen not in the model layer, but in the pipes that connect models to real data and real users.
Agentic AI and the Next-Generation Tech Stack
Agentic AI — systems that plan, reason, and take actions autonomously without step-by-step human prompting — is the fastest-evolving segment of the AI tech stack. These statistics reflect where the market is heading from 2026 onward.
- 40% of enterprise applications will include task-specific AI agents by 2027, up from less than 5% in 2025 (IDC forecast, via Joget)
- 47% of Y Combinator's Spring 2025 cohort is building AI agents — a leading indicator of where developer attention and VC funding is converging (Thunderbit, 2026)
- 57% of LangChain survey respondents have AI agents in production; quality remains the top barrier (LangChain State of AI Agents Report)
- 34% of enterprise marketing teams run at least one autonomous AI agent in production, up from 14% in Q4 2025 (digital marketing AI adoption survey 2026)
- Gartner predicts agentic AI will resolve 80% of common customer service issues without human intervention by 2029 (Gartner, via Joget)
- By 2028, 15% of day-to-day work decisions will be made autonomously through agentic AI, up from 0% in 2024 (Gartner)
- More than 40% of agentic AI projects will fail by 2027 — Gartner's warning mirrors overall AI failure rates, suggesting the pattern repeats for each new wave (Gartner, 2026)
Agentic AI framework adoption is now trackable from actual survey data, among developers actively building agents: - Ollama: 51% most-used framework for AI agent orchestration among developers building agents - LangChain: 33% of developers building agents use it for orchestration - Both figures come from the Stack Overflow Developer Survey 2025 — representing adoption rates among the agent-building segment of the developer population, not overall developer adoption
A typical agentic AI stack combines an LLM API (Claude or GPT-4o), an orchestration framework (LangChain or Ollama), a vector database (ChromaDB or Redis), and an observability tool (LangSmith or Weights & Biases). 89% of agent builders already have observability in place — but only 52% run evaluations, leaving a critical quality gap.
Enterprise vs. Startup AI Stack: Key Differences
Startups and enterprises approach AI infrastructure differently — in scale, complexity, tooling, and risk tolerance. These differences matter when benchmarking your stack against market norms.
| Dimension | Enterprise (5,000+ employees) | Early-Stage Startup (<100 employees) |
|---|---|---|
| Models in production | 4.2 avg (Gartner, 2026) | 1-2 models (mostly API-based) |
| Monthly AI spend | $15K–$100K+ | $500–$15K depending on stage |
| Stack complexity | Multi-layer: LLM + MLOps + fine-tuning + compliance | Minimal: LLM API + basic orchestration |
| MLOps maturity | Dedicated MLOps team, model versioning, drift detection | Minimal — often just API logging |
| Primary LLM provider | Anthropic (40% share), OpenAI (27%), Google (21%) | OpenAI or Anthropic API (most common entry points) |
| Data infrastructure | Data mesh, feature stores, dedicated pipelines | Basic databases + ad-hoc data prep |
Sources: Gartner via Medha Cloud; Menlo Ventures 2025; Finout, 2026
Size drives AI adoption disparity: 83% of companies with 5,000+ employees have deployed AI vs. only 42% of firms with 50-499 employees (enterprise AI adoption analysis 2026). The gap is narrowing as managed AI APIs lower the technical barrier to entry — but the operational complexity gap remains significant.
See detailed AI tool comparisons for startups →
What These AI Tech Stack Statistics Mean for Your Startup
The numbers point toward a set of consistent, actionable patterns. Based on the data collected across this article, here is what the AI tech stack statistics for 2026 actually indicate for founders and engineering leaders:
1. Invest in data quality before tools. Data quality and readiness is cited as a top obstacle by 43% of organizations — alongside lack of technical maturity (43%) and shortage of AI skills (35%) (Informatica CDO Insights 2025). The stack matters less than the data it runs on.
2. Plan for costs to exceed estimates — significantly. Budget 30-50% above API cost estimates and assume monthly spend increases significantly between prototype and production stages.
3. Multi-model strategies are now standard.59% of developers run three or more AI tools in parallel. Avoid vendor lock-in: OpenAI's enterprise share dropped from 50% to 27% in two years. A stack that assumes a single LLM API is a fragile stack.
4. Move from experimenting to evaluating.95% of pilots fail to reach production — primarily due to infrastructure gaps and lack of evaluations. Only 52% of agent builders run evals. Adding systematic evaluation early is one of the highest-leverage technical investments a startup can make.
5. Agentic AI is the near-term frontier — plan for it now. IDC projects 40% of enterprise apps will include AI agents by 2027, up from under 5% in 2025. The startups building agentic infrastructure today are positioning for the next competitive window.
Read our full guides on AI infrastructure for startups →
Frequently Asked Questions
What is an AI tech stack?
An AI tech stack is the set of tools, frameworks, cloud infrastructure, and data pipelines an organization uses to build, deploy, and scale AI-powered applications. It typically includes foundation models or LLM APIs, orchestration frameworks, vector databases, MLOps platforms, and cloud compute infrastructure.
What percentage of startups use AI tools in 2026?
According to HubSpot's Startups AI Report 2025, 80% of early-stage SaaS startups use AI tools. However, 78% of organizations use AI in at least one business function while 62% remain in experimentation — full enterprise-wide scaling is still uncommon (Netguru, 2026).
How much does an AI tech stack cost for a startup?
Costs vary by stage. MVP/Beta startups (0–100 users) typically spend $100–$500/month on AI infrastructure. Early Growth deployments (100–1K users) run $500–$2,000/month. Scale-stage startups (1K–10K users) typically spend $2,000–$15,000/month, and enterprise-scale deployments (10K+ users) reach $15,000–$100,000+/month. Budget 30-50% above projected API costs for retries and edge cases (Finout, 2026; LLM cost modeling guide).
What are the most popular AI frameworks startups use?
Based on the Stack Overflow Developer Survey 2025, Ollama (51%) and LangChain (33%) lead for AI agent orchestration among developers building agents, and Redis (43%) is the most commonly used tool for AI agent data storage. PyTorch holds over 55% of production ML framework share (Kellton, 2026).
What is the ROI of AI for startups?
The average ROI is $3.50–$3.70 for every $1 invested in AI, according to IDC and Microsoft research. AI-native startups also grow significantly faster — reaching $30M ARR in 20 months vs. 60+ months for traditional SaaS (Cubeo AI / BVP Atlas).
Why do most AI projects fail?
More than 80% of AI projects fail to deliver intended business value (Pertama Partners, 2026). The three primary obstacles: data quality and readiness (cited by 43% of organizations), lack of technical maturity (43%), and shortage of AI skills (35%) (Informatica CDO Insights 2025). Additionally, 95% of GenAI pilots fail to reach production — primarily due to infrastructure limitations (MIT NANDA, 2025).
What AI frameworks do startups use for agent development?
Ollama (51%) and LangChain (33%) are the most-used agent orchestration frameworks (Stack Overflow Developer Survey 2025). For observability, LangSmith and Weights & Biases are common choices — 89% of agent builders have implemented some form of observability, though only 52% run formal evaluations (LangChain State of AI Agents Report).
What is the AI talent gap?
There are currently 1.63 million open AI roles vs. approximately 518,000 qualified candidates — a gap of over 1 million positions (Thunderbit, 2026). This talent shortage makes vendor-managed AI tools and managed APIs more attractive for resource-constrained startups.
Is the AI market growing?
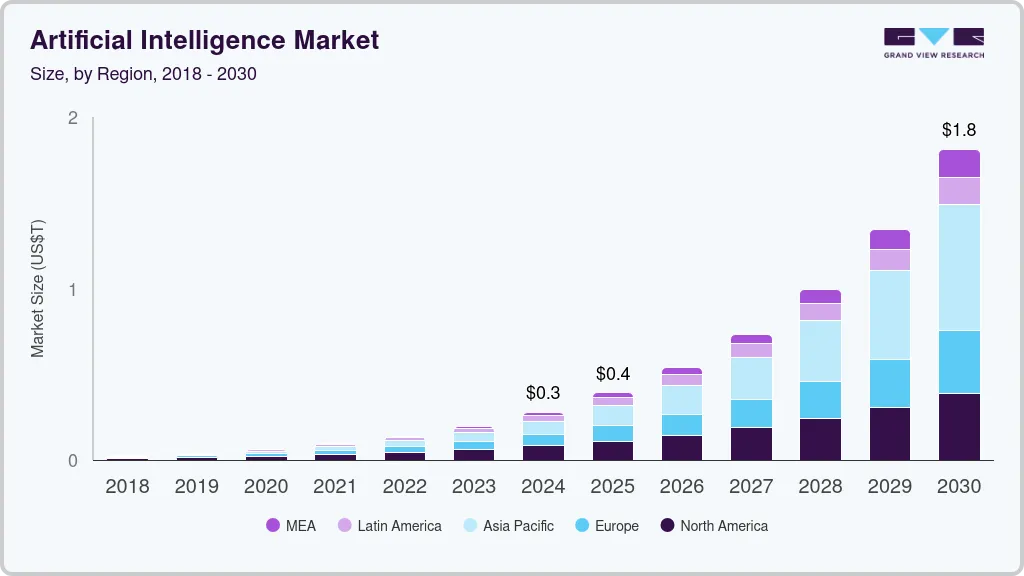
The global AI market is growing at a 36.6% CAGR from 2025 to 2030, with projections reaching $1.81 trillion by 2030 (Grand View Research, 2025). Gartner forecasts worldwide AI spending at $2.52 trillion in 2026 alone — up 44% year-over-year (Gartner, January 2026). Additionally, McKinsey estimates generative AI could add $2.6T–$4.4T annually in economic value across industries.
What is the difference between an AI tech stack and a traditional tech stack?
A traditional tech stack consists of web servers, databases, application frameworks, and front-end layers — all deterministic components that behave predictably. An AI tech stack adds non-deterministic layers on top: foundation models or LLMs that generate probabilistic outputs, vector databases for semantic search and retrieval, orchestration frameworks for multi-step AI agents, and MLOps tooling for monitoring model drift and retraining pipelines. The AI layer introduces new cost variables (per-token API pricing, GPU compute) and new reliability challenges (hallucination, latency spikes, and evaluation gaps) that traditional software stacks don't face.
How do enterprises and startups differ in their AI tech stack approach?
Enterprises run an average of 4.2 AI models in production (Gartner, 2026) with dedicated MLOps teams, multi-cloud infrastructure, and compliance tooling, while early-stage startups typically run 1-2 models through hosted APIs with minimal orchestration. Enterprises spend $15,000–$100,000+ per month on AI infrastructure versus $100–$2,000 for pre-PMF startups. The operational complexity gap remains large even as managed API services lower the barrier to initial adoption — 83% of companies with 5,000+ employees have deployed AI, versus only 42% of firms with 50-499 employees.
All statistics were sourced from publicly available research reports as of April 2026. For the most current data, refer to the linked primary sources. See Calliber's AI news section for ongoing market updates.
Get the weekly
One essay + 3 tools worth your attention, every Tuesday.
you@company.com